
How to Use the Histogram in Photoshop
The histogram is one of the most informative and useful tools available to photographers in Photoshop. Although it may seem confusing at first, it can provide a wealth of information and help improve your editing in Photoshop. In this article, we'll cover the basics of how to use the histogram in Photoshop.
Get my eBook: 25 Techniques all Photographers Should Master - for Free
What Is The Histogram?
The histogram is essentially a graphical representation of your photo. It takes into account each color channel and the brightness of the image.
Comprising 256 bars, each representing a different color channel, the histogram represents the tonal range of your image - from blacks, shadows, highlights, and white points. The taller the bar, the more pixels there are from that color channel.

The histogram in Photoshop
How To Access The Histogram In Photoshop?
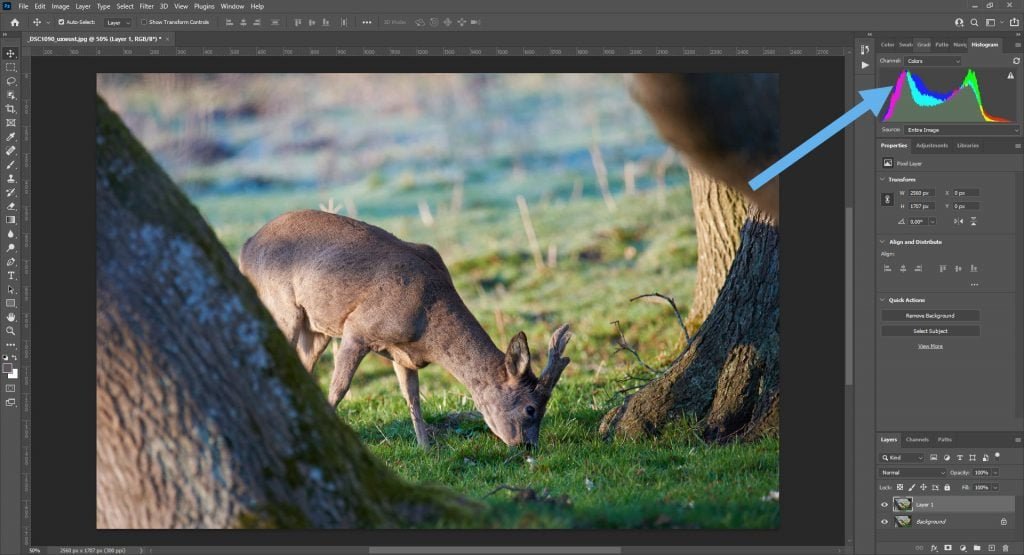
You can find the histogram in photoshop in the right-hand toolbar, usually, Photoshop has already expanded your panels, but if not click on the icon shaped like a jagged histogram graph.
If you can’t see this icon or the histogram panel itself, you’ll need to activate the histogram panel by going to Window>Histogram.
This will open a floating histogram panel which you can dock to your right-hand toolbar
The histogram
With your histogram panel open, you can now choose from several different viewing options by clicking the menu bar at the top right-hand side of the panel.

There are three main options to choose from:
Compact view shows only the histogram.
The expanded view shows a larger view of the histogram with added stats.
All Channel's view will show the complete histogram and individual histograms for each color channel.

all channel view of the histogram in Photoshop
All channel view
Switch between which channel you want to be shown on the histogram by choosing from a drop-down menu above the histogram. You have the option of viewing the histogram for one color (red, blue, or green), for seeing luminosity, or for seeing all of the colors combined.
How To Read The Histogram In Photoshop
Unless you work in the Adobe Camera RAW filter inside Photoshop, there is little you can do to the histogram directly. However, learning to read it and use its values is extremely helpful for your editing process.
The peaks and valleys that make up the Histogram provide a wealth of information about your photo and how it could be improved. The left side of the histogram represents the blacks/shadows, the middle represents the mid-tones and the right side represents the highlights / bright areas. A gap on the left, right, or both sides indicates that you didn't capture the full range of tones in the scene.
When looking at the histogram, there are a few things to look for to tell if your photo is a good one.
If the histogram stretches across the bars from both left to right. This shows that you have captured a good tonal range.
There are no extreme peaks. Some peaks are natural depending on what you are photography, however, extreme peaks suggest that your photo may be out of balance.
The graph isn’t pushed to one side. If your bars are heavily concentrated in a peak to the left or the right, this suggests that your image is over or underexposed. (under if it’s towards the left, and over if it’s towards the right). However for really dark scenes the bar should be leaning towards the left, and opposite for really bright scenes.

How Does This Show Up In The Histogram In Photoshop?
To better understand how the histogram works, it’s useful to see how it presents in photos.
Shadowy Images

Photo credit: Unsplash
In this very dark, shadowy image, the histogram is showing a high peak to the left of the graph. This represents the shadows of the image. There aren't many mid-tones or bright patches, as a result, there are no high bars to the right of the image.
There is one small bar peak to the right-hand side, representing the bright sun peeking through the trees. Lifting the shadows may improve the image somewhat by bringing in some mid-tones to the image and increasing the level of detail.
High-Contrast Images

Photo by Warren Wong on Unsplash
In this image, we can see that there is a very stark contrast between the foreground and background. This shows up in the histogram as two sharp peaks to the left and right of the image. Usually, this would be a sign of too much contrast in an image. For this image, the effect works nicely, a good reminder to always use your creative judgment!
Bright Images

Photo by Dominik Schröder on Unsplash
In this photo we can see there is a lot of light and white dominating the image. This is represented in the histogram by a sharp peak to the left, indicating that the image is overexposed. Although it gives a dreamy effect, some of the detail can be lost in an over-exposed image, particularly in these clouds.
The Histogram is Affected and Used by other Tools in Photoshop
Almost all of the modifications you do in Photoshop will affect the overall tonal values in your image. Therefore it also affects the histogram in Photoshop. So if you increase the exposure using an Exposure Adjustment Layer, and pull the exposure slider to the right, then the histogram will also shift towards the right reflecting the changed tonal values.
Curves Adjustments
If you open a Curves Adjustment Layer you will see a histogram underneath the adjustment curve. This represents the histogram of the layers below the curves adjustments are made, so it won't update as you change the curve. However, to top histogram tool in the sidebar reflects the changes.

curves adjustment layer in photoshop
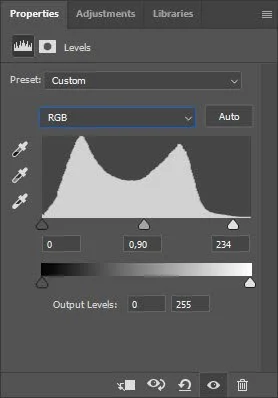
Levels Adjustments
If you take a look at the Levels Adjustment Layer, you will see similar behavior. It shows you a histogram representation of the active layers below the Levels Adjustment Layer. It gives you an indication of where in the image there are no data and lots of data, which is valuable when making the adjustments. So this histogram isn't affected by any changes you make in the levels.
levels adjustments in Photoshop
Final Thoughts
The histogram may look confusing at first, but it is a useful tool for looking beyond what the eye can see. After many hours spent editing, your eyes can become desensitized and struggle to make creative choices. Here, the histogram can help. Getting into the habit of regularly checking your histogram can save you from accidentally over-exposing an image, or help you fix an image that feels lackluster.