How To Use The Histogram To Capture Better Photos
Do you have trouble with getting the correct exposure in your photos? With a good understanding of how the histogram works, you will be able to get the best exposure, more often than not. So it is well worth digging a bit into learning how to use the histogram and what a histogram is in photography.
What Is A Histogram?
A histogram is a visual graph that shows how much of each tonal value from dark to bright that are present in a photo. You can use it to tell if the image is well-exposed. In short, you do this by noting if the image's histogram contains tonal values from both shadows and highlights. You should also make sure that the tonal values captured don't stack up against either the left or right side of the histogram.
Get my eBook: 25 Techniques All Photographers Should Master - for Free

How to read the histogram
Now, that was the short version. You need a little more understanding of how the histogram works to be able to use it properly.
Use The Histogram And Avoid Coming Home With Badly Exposed Photos
It took a long time before I understood how to use the strange multicolored Everest like peaks that my camera displayed on the rear LCD screen. My first idea was how do I turn this damn histogram display off, but then again I decided to give it a chance if nothing else it looked kind of important.
However, at first, I didn’t bother to find out how I could actually use it to get better-exposed images.
Not until much later, when I was standing knee deep in cold water with a beautiful sunrise.
I wished that if only I knew how to read the histogram, I could be more certain that I nailed the exposure right, instead of relying on the jpg-preview that the LCD showed me.
The histogram on the back of your camera can help you get better-exposed shots. However, it is often misunderstood.
One of the first things to know is that the histogram cannot save your exposure every time, and it is not necessary to use it every time either. But if you use it selectively, you can get help to nail the exposure in difficult situations at the scene, instead of trying to fix it later in post-processing.
In this article, you will learn how to read the histogram, so you can use it to get better exposures, so you don’t have to push your images too much in post-processing.
I want to emphasize that you can learn to use the histogram to get a ‘better’ exposure instead of a ‘correct’ exposure since this is very much depending on the intent you have when taking and creating your images.
High-contrast scenes, such as sunsets, portraits with backlighting, and snowy landscapes, can pose a challenge for photographers because they often contain a wide range of light and dark tones. Using the histogram can help you capture these scenes effectively by ensuring that both the highlights and shadows are properly exposed.
If you use the key-points in this article, you will increase your keepers rate of images shot in difficult lighting conditions.
How Do You Read The Histogram?
When you look at a histogram the first time, it looks confusing. However, get ready to cast this confusion away with this simple explanation:
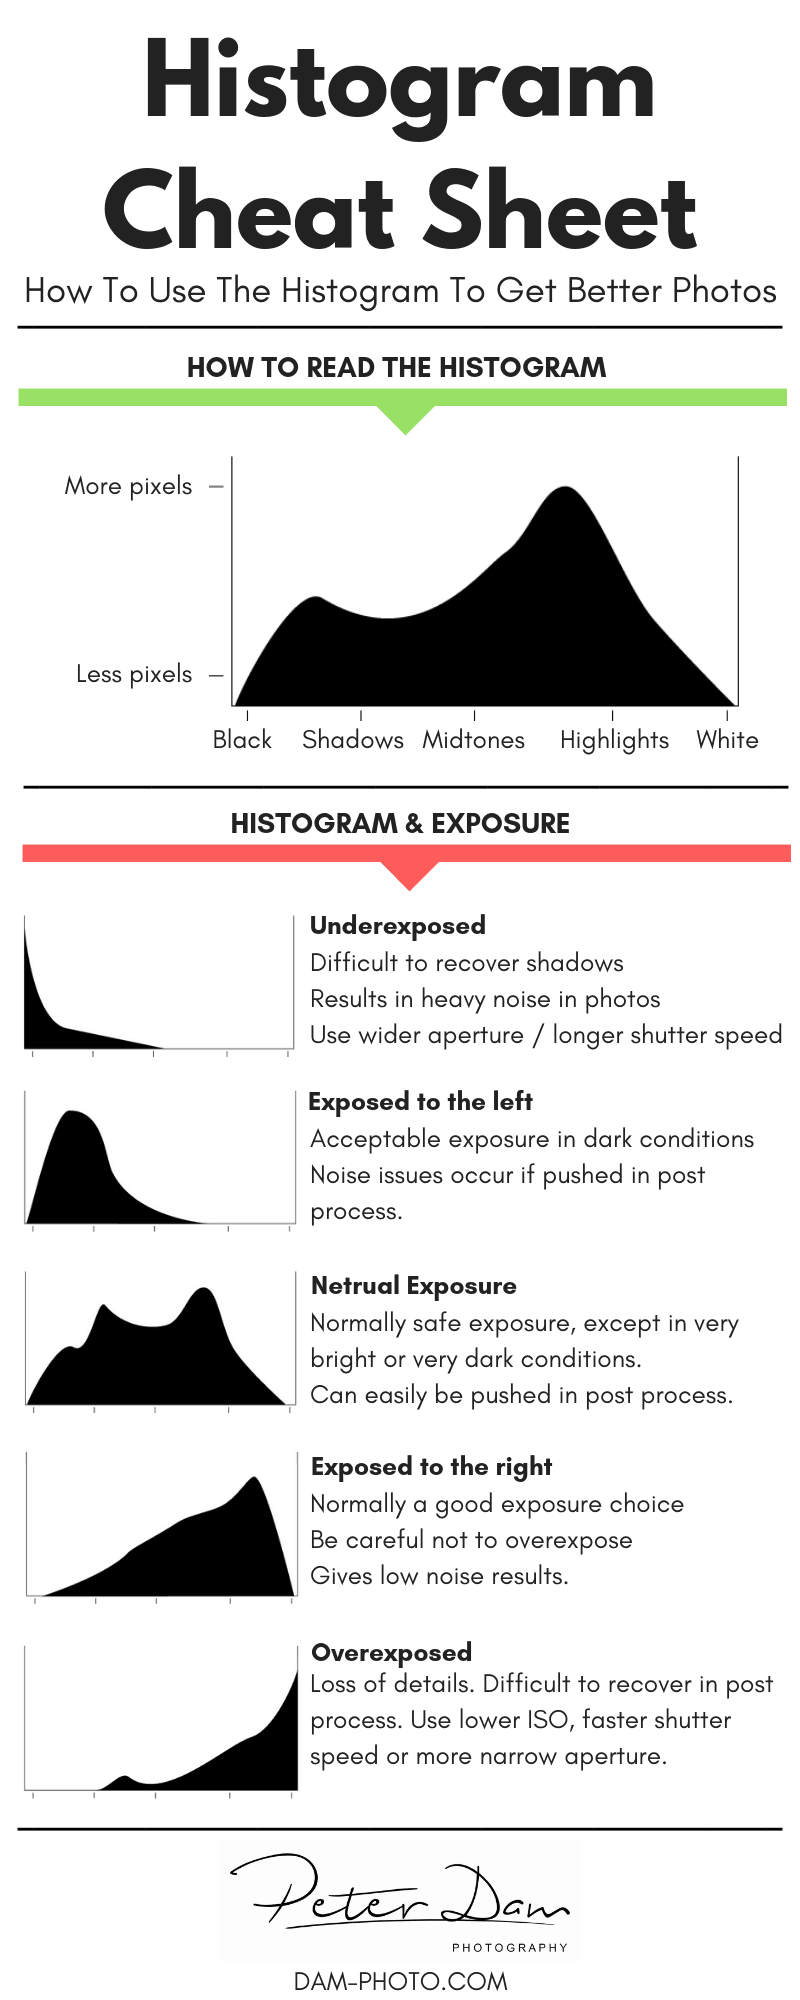
The histogram shows you how many pixels of each tone, from dark to bright, you have in your image.
It is just like a light meter, except that it analyzes or reads brightness values in the image you have just taken, and not before you take it as a light meter does.
The horizontal axis (left-right) is about the tone. And the vertical axis (height) shows how many pixels are found at each particular brightness level.
You can think of the histogram as a lot of bar graphs all compressed with no space between each bar.
You can divide the histogram into subsections, to make it easier for you to read it:
This is a good time to make it clear that you should mostly focus on the horizontal axis. It is far more important what is happening from left to right than how high the graph is.
Why Use The Histogram?
Now that you know what a histogram is and what you tell from looking at it, it is easier to understand its usefulness.
If you rely on the LCD image preview on the back of your DSLR, you might fall into a couple of pitfalls.
The preview on the LCD might fool you into thinking you have got the right exposure if it is set too dark or too bright.

Nikon d810 monitor brightness and histogram
Also in low light conditions, even an underexposed image can seem bright, because of the backlit LCD screen emits light.
A histogram is more reliable as it doesn’t vary according to the viewing condition.
How To Display The Histogram On Your Camera?
To enable a histogram on a Nikon DSLR, go to the menu and select Playback menu. Then choose Playback display options.
Now scroll down to the Overview option and activate it by pressing the right side of the multi-selector button. Then press OK.
You can also choose to activate the RGB histogram, which will show you a more complex and detailed histogram.
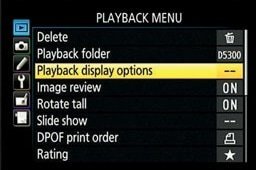
nikon dslr playback menu
Choose the playback display options in the playback menu.
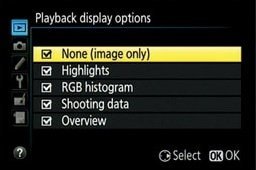
nikon dslr playback display options
Chose the Overview option to activate the histogram display. RBG histogram will give you a more complex histogram.
After you have captured a photo and can see it on the back of your camera’s LCD monitor, just press up or down on the multi-selector button until you come to the overview display.
On some Nikon DSLR models, you can also activate the histogram in the Live View, which is very useful if you use your camera on a tripod.
In Live View, the histogram becomes a light meter in the sense that it analyses the brightness values in the scene before you capture the image. If you change the composition or zoom in, the histogram will update to reflect the brightness of the scene that is now within the frame.
Canon users can press the info button during image review/playback to bring up the histogram.
What Is The Ideal Histogram?
There is really no ideal histogram, as every image and scene is different. However, we can use the histogram to see if the exposure is good or if it has issues, which could be corrected.
Even though there is no “ideal” histogram. We can look at some examples to better understand how the histogram helps us to get a better exposure.

Middle exposed histogram
The key to getting a good exposure is to know what to expect. If we have a scene or composition with a lot of mid-tones, without very bright areas or extreme shadows, we should expect a histogram of a well-exposed image would show that you have captured just a few black tones, and a few white tones, with plenty of image data in the middle.
Just like on the image above with the fur seal pup.
If your subject is very dark, and you expose to get a “perfect” looking histogram with plenty of image data in the middle of the histogram, your image would look awful with dark tones turning gray.
For instance, if you shoot during the blue hour (where it is quite dark), your histograms will tend to have much more data in the left side, because it is very dark at that time of the day.
Like in the image below, where there is a lot of dark tones, a few mid-tones and barely any highlights.
If I tried to force the exposure to have a more normal looking histogram that peaks in the middle, the dark areas would look gray instead of like how it was at the scene.
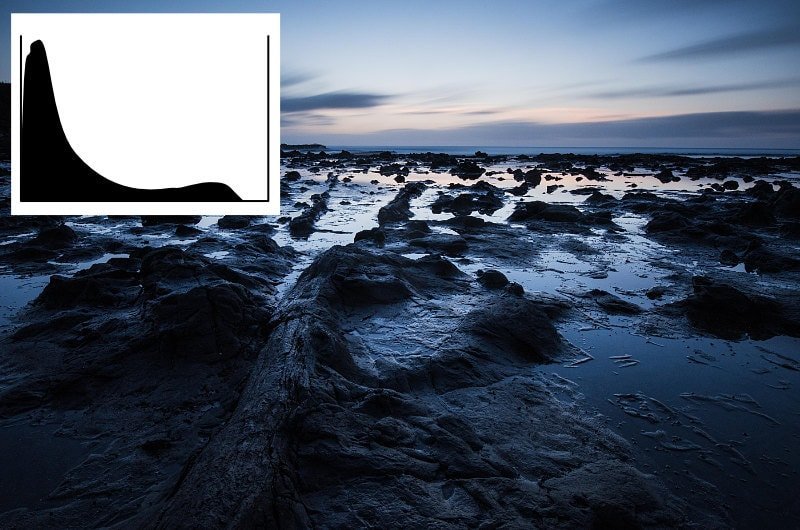
Exposed to the left - blue hour
In the opposite scenario, if you take images in very bright conditions, like in snow or sand, and try to expose for a middle peaking histogram, the snow will look gray and flat. So we shouldn’t try to do that.
Instead, a good looking histogram in very bright conditions is stacked well to the right of the middle but without climbing the edge to the far right.

“What is bright in real life should show up at the (b)right side of the histogram. What is dark in real life should show in up the dark/left side of the histogram.”
So when you make use of the histogram, your task is to make sure that the histogram you see when you capture an image, is reasonably based on what you see in the viewfinder.
If not, you should change the exposure to compensate for the faults and capture the image again.
When Should You Adjust The Exposure?
On some of your histograms, you will likely see spikes up the left or right edge. These edge-crawling spikes indicate “clipping” of either the highlights or the shadows, and therefore loss of details in the image.
If the histogram crawls up the side to the left, it means that you capture pure black colors with no details in it. And the opposite, if the histogram crawls up the side to the right, it means that you capture pure white tones, without any details.
In real life, we sometimes see dark shadows that we can’t see with the naked eye, so this is less of a problem than with the highlights. Our image can still look great and natural, even though there might be a few clipped pixels to the left in the dark areas.
In real life, however, highlights don’t appear as large areas of pure white. Note the histogram below, has quite a lot of pixels stacked up towards the right of the histogram and has clear signs of clipping.
When this occurs, you should change the exposure, so you avoid losing details in either the shadows or in the highlights.
If the histogram shows that you lose details in the highlights, the image is overexposed, and you should change the exposure, so it is a little darker, by using a smaller aperture, a faster shutter speed, or a lower ISO. If you don’t do it, you might be missing out on details in the highlights, because they are captured as pure white.

histogram showing highlight clippings
If on the other side, you have a histogram tilting heavily towards the dark side and a gap with no data in the right/bright part of the histogram, you can safely change your exposure to become a little darker so you can capture more bright tones. You do this by raising the ISO, using a longer shutter speed or shooting with a more open aperture.
As you can see on this histogram on the image below it peaks to the far left at the edge which means you’re losing details (arrows). This image is underexposed. Changing the exposure and allow for more light to enter the camera would have created a better result with more image data.

Histogram shows clipping in shadow zone

How exposure settings affects the histogram
Generally, you should try to expose your image, so the histogram doesn’t crawl up the edges of the histogram.
A slight amount of pixels touching the edges is OK, especially if you shoot in RAW since the histogram in your DSLR is based on the jpg-preview version that the camera uses to show you how the image looks like. And as you probably know RAW files contain more data, which makes it likely that you can recover the details, if the histogram touches the edges slightly.
However, if you have spikes up either side of the edges, the exposure will suffer, and it can be difficult to get a decent image out of it.
How To Activate Highlight Warning On Your Camera?
On most DSLR’s you can also turn on a highlight warning on the LCD that will show you when clipping occurs. When activated any overexposed areas will blink when you preview your images on your camera’s LCD.
On a Nikon camera, you can find this blinking highlight warning by pushing up or down on the multi-selector button, cycling through the different info screens while previewing an image. Note, that you might have to activate the highlight warning under playback display settings in your camera.
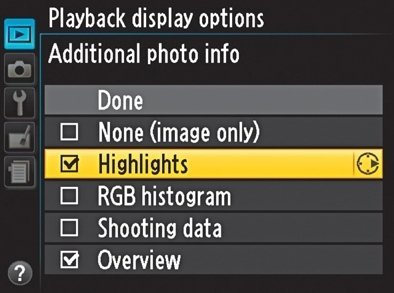
turn on highlight warnings on nikon
On a Canon camera, you should press the “Display” or “Info” button, until the highlight warnings show up on the screen while previewing an image. If you cannot find this display option, go to the playback menu and activate Highlight alert.
Two simple questions that will help you tackle the tricky situations?
If you make a habit of asking yourself two simple questions before you push the trigger, you will get a much greater understanding of the scene and more importantly a greater understanding of light.
You only need these two questions, and they will help you understand the scene concerning tonal values and light:
Where is the brightest part of the scene?
Where is the darkest part/shadows of the scene?
Once you know the answer to these two questions, you can more easily work with how the shadow falls, the source of light and its direction.
The questions will help you identify extreme highlights, which you might want to leave out of your composition if possible.
They can also help you a great deal in not only understanding the scene but also giving you an indication of how your histogram should look like.
I Got Spikes Crawling Up on Both Edges. What Does It Mean?
In high contrast scenes, it can be difficult to get a normal looking histogram. If you shoot against the sun, you will get spikes in the extreme highlights and in the deep shadows.
This happens a lot in sunset photos you take when the sun is still visible on the horizon.
Another scenario is when you shoot through a window from inside a room, where you also have the window pane in the image.
How To Fix The Exposure Based On The Histogram Reading?
You cannot really fix it, because the scene does have a lot of contrast. A lot more contrast than your camera can capture in a single shot. However, you can choose whether you want to shift the exposure, so you keep the highlights or the shadows.
In these situations, you will have to decide whether you want to retain the details in the highlights, or in the shadows. Which is most important for you, and will it leave you with a usable image?
If in doubt, you can opt for a bracketed exposures (one or two stops apart) where you take three images of the same scene. When using the bracket function on your DSLR the camera underexposes one image to capture the highlights. It also takes an image with a normal exposure. Finally, it takes and overexposed image to capture the details in the shadows.
This allows you to decide later, which one to keep. It also allows you to merge the bracketed images into an HDR or manually blend the exposures in Photoshop or Affinity Photo.

Bracketed photos with histogram
By bracketing photos, you take an underexposed, normal exposed, and an overexposed capture of the same composition, which you can then later combine into one single photo. Alternatively, you can also just choose the exposure you prefer to process.
Concluding Words On How To Use The Histogram To Get Better Photos
In summary, I advise you to use the histogram at the back of your camera when the lighting at a scene is tricky. This could be when you have areas of deep shadows and bright highlights in the same composition. Or when you want to take a series of shots with the same setting and want to be sure that you have a good exposure.
A quick look at the histogram will reveal if parts of your image are over- or underexposed.
If it is underexposed, your image will lack details in the highlights. In this case, the histogram will display a heavy concentration at the left side with spikes leaning right at the edge at the left side of the histogram.
How can you fix this? You can do this by opening the aperture a bit (using a lower f-number), using a slower shutter speed, or by increasing the ISO.
If the histogram, on the other hand, tells you that the image is overexposed, you can fix it by doing the opposite. Use a faster shutter speed, close down the aperture (use a higher f-number), or decrease the ISO setting.
It does take time before you will master the histogram. Gradually over time, you will become more skilled in using the histogram.
Make it a habit to look at the histogram, and correct the exposure when you find that it doesn't match the tones in the scene you try to capture.
Below I have made a summary of how to understand the histogram into a cheat sheet: